Worcester RTC data - update with 2024 data
One of the often cited barriers to getting more people to choose a bike as a mode of transport is the concern around safety, notably cycling on busy roads sharing space with people driving cars. This is apparent even at a city level when reviewing the Worcestershire Active Travel Consultation Survey results, notably drilling down into the section on Worcester (starts on page 57), where 64% of respondents disagreed with the statement 'I feel confident cycling on the roads in Worcester'.
Even those of us who choose the bike for most their journeys in and around the city acknowledge a requirement to have a thick skin when using the city roads, albeit with experience and adult Bikeability training (highly recommended) it is possible to improve the safety of yourself and those around you even on two wheels. In addition Bike Worcester volunteers are regularly reporting illegal driving using West Mercia's Operation Snap portal, and mapping close passes to share with the City and County Councils and the police.
The solution to this being deployed in other cities in the UK and beyond it to design and implement dedicated segregated cycleways, sensibly separating the different modes of transport travelling at different speeds, typically walking (3 mph), cycling (12 mph) and motor vehicles (20 - 70 mph). Unfortunately in Worcester genuinely segregated infrastructure is rare; off the top of my head now I can think of a few locations in Worcester, which might run to a few hundred metres in total (blog incoming). That's not to say that the shared use footway / cycleways (canal towpath, riverside, St Peters, Warndon Villages) aren't welcome, but this still mixes two modes of transport travelling at different speeds, not to mention other variables such as dogs, and other users such as people fishing. As a pedestrian I've often been caught unawares by people riding bikes (although interaction on the whole is cordial), and as a bike rider despite best endeavours, I've been the surpriser. My personal view is this is a design issue, with many of the paths (including the recently resurfaced canal tow path) simply being too narrow for their intended use as a shared footway / cycleway.

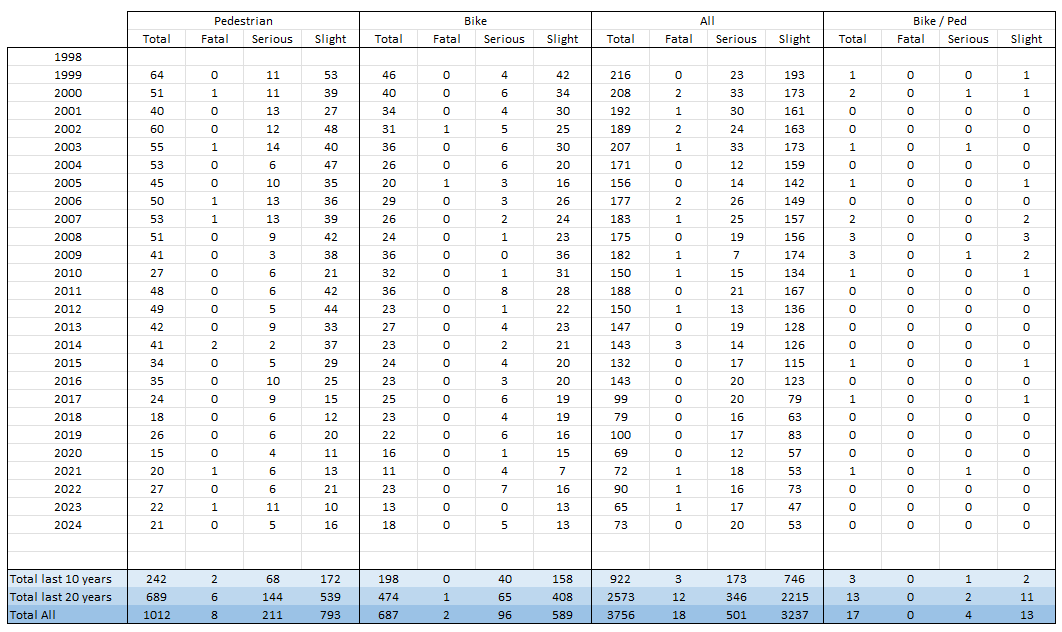
So given our perceptions, it seems sensible to review any available data on Road Traffic Collisions (RTCs) for Worcester. A fantastic resource is a website called Crash Map, which posts the location and summary of every reported RTC in the UK, from 1999 - 2024. This is particularly useful to use as evidence to highlight the inaccuracies in arguments put forwards by some of our elected councillors, notably around the dangers posed by people riding bikes to pedestrians, but we'll come to that later.
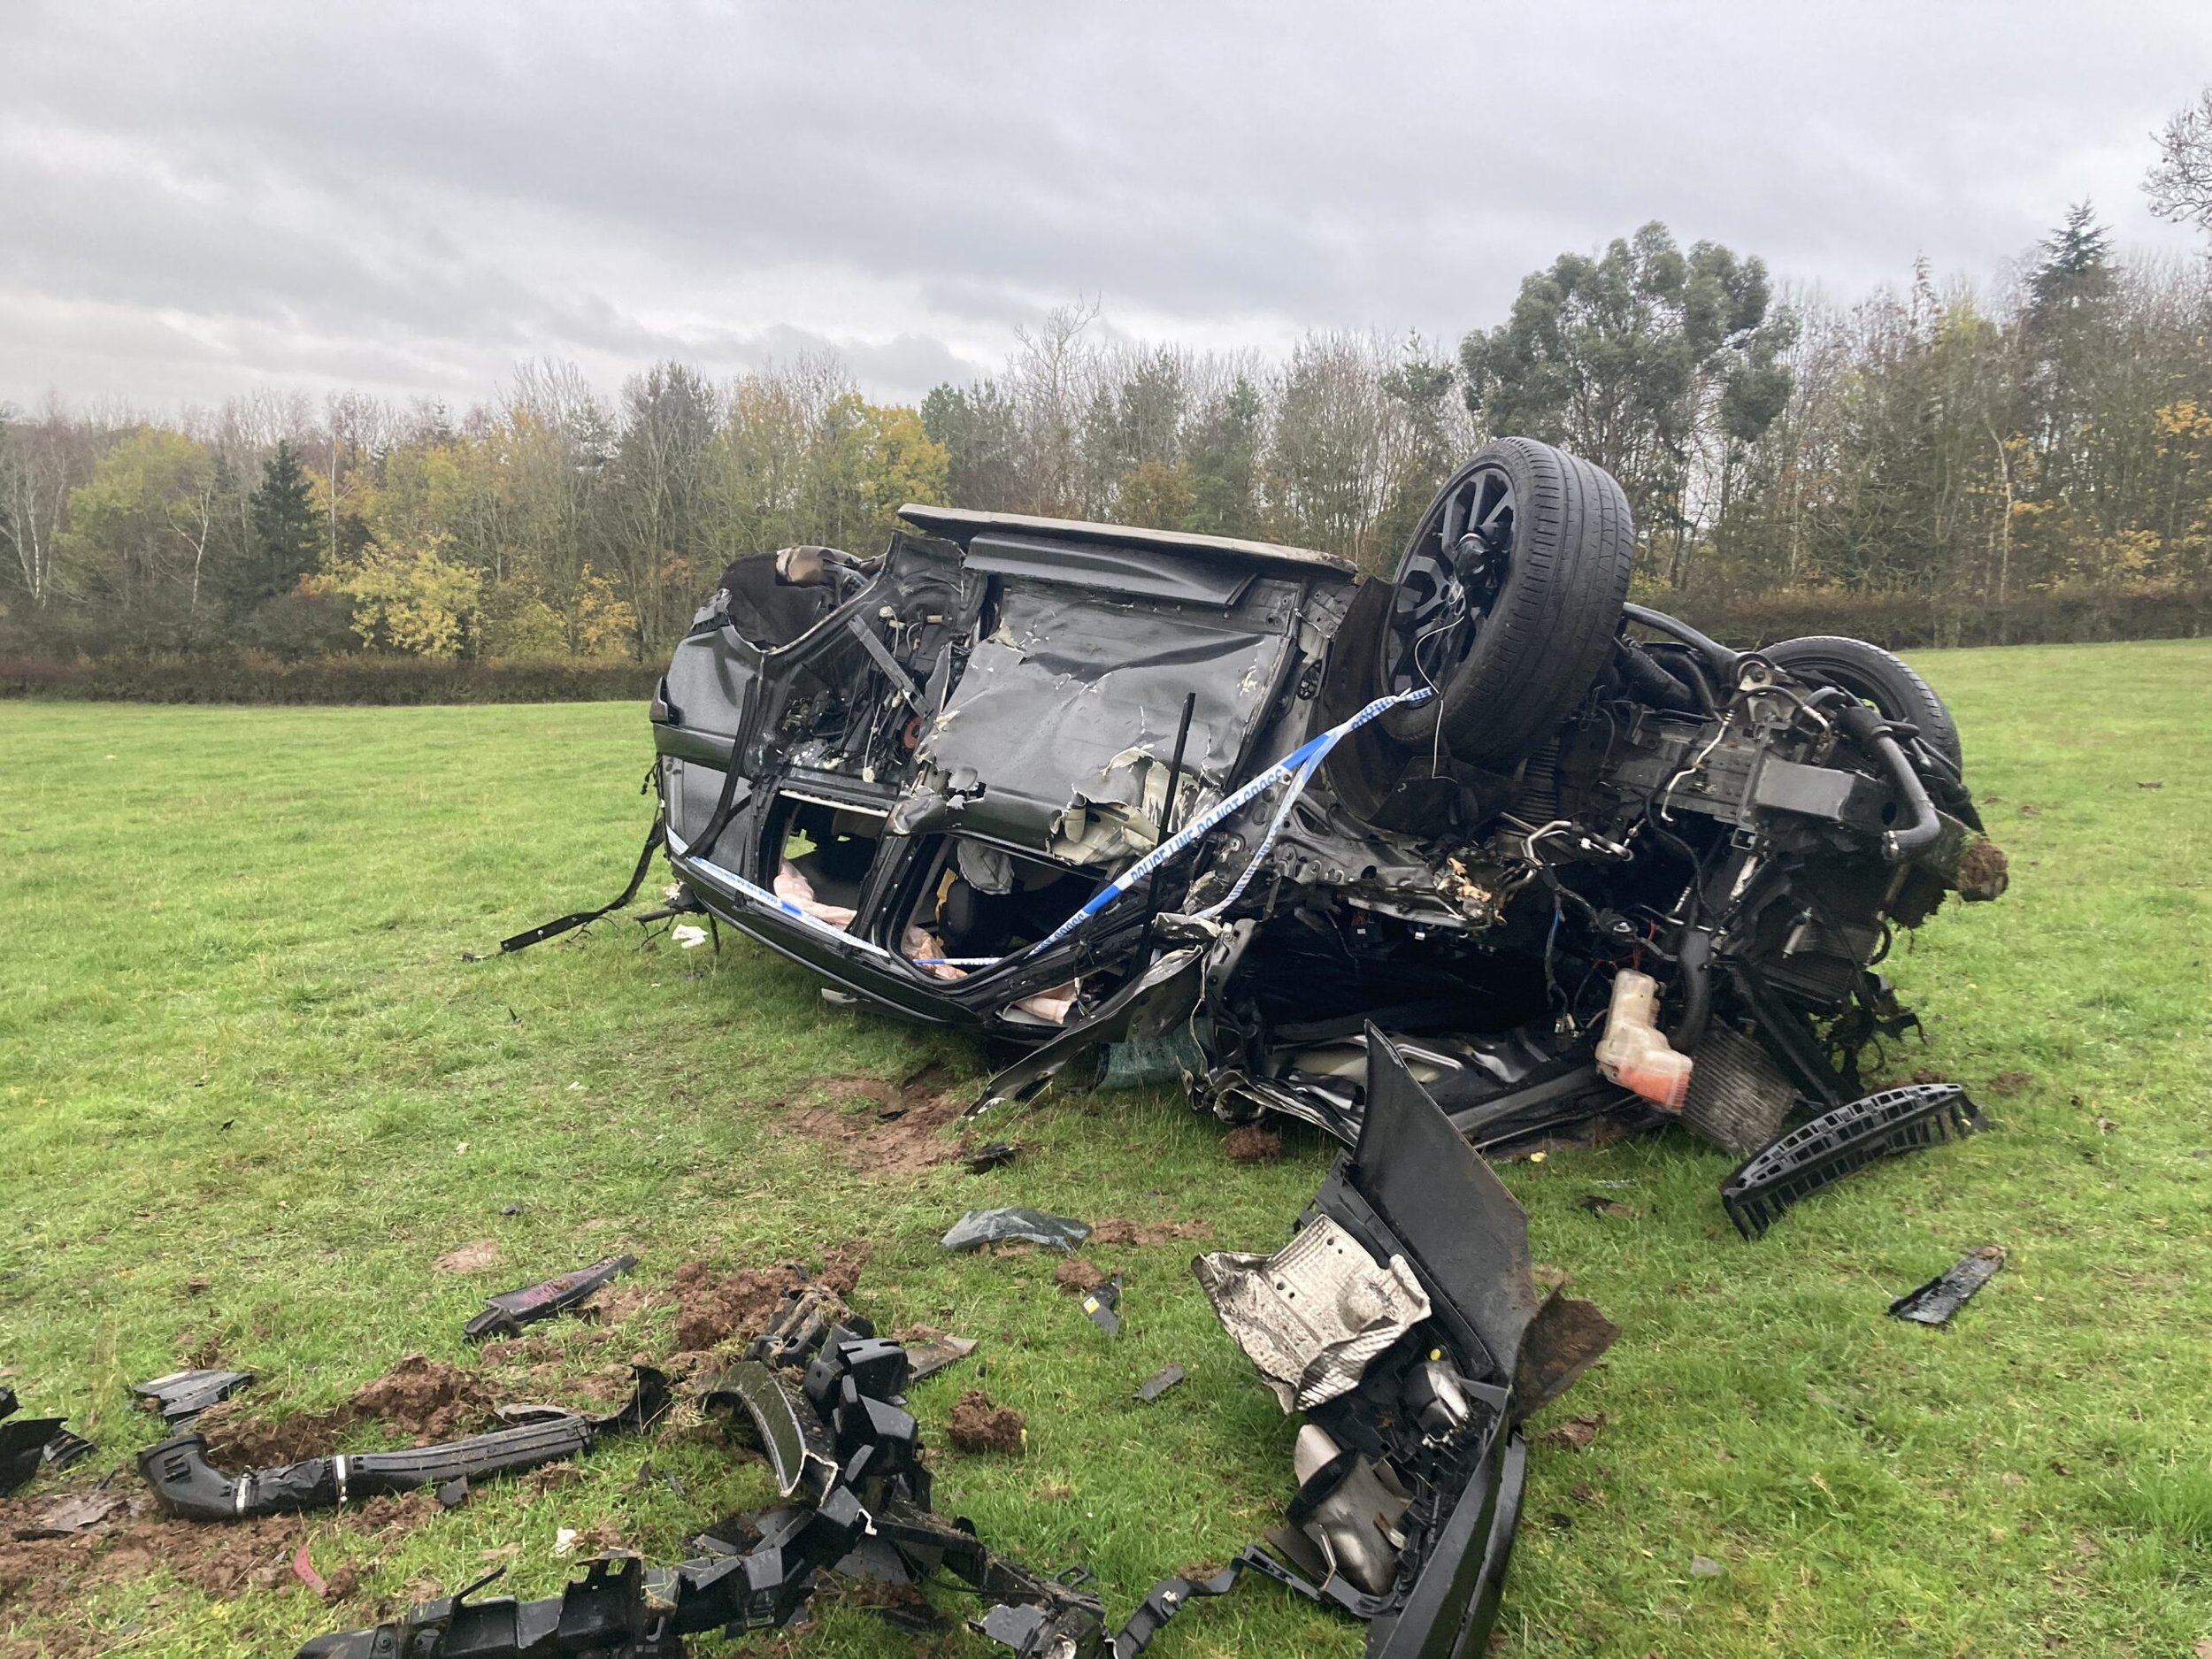
Crash Map enables you to filter the data by year, vehicle types, casualty types, and severity for any given area. So fixing the map on an area roughly covering Worcester (see above) and exporting the data enables us to have look at some of the trends. It should be noted that for every single RTC documented here there is human cost, ranging from damage to property at the bottom end, to injury, physical and emotional pain, trauma, medical treatment, hospitalisation, with some injuries being life changing, and tragically 18 fatalities. None of this is taken lightly. The extraction of data from Crash Map is based on the visible window and not a true border of Worcester (more an approximation of Worcester), however I’ve demonstrated that this method is repeatable.
Feel free to have a nose at the information, and I'd be happy to chat about conclusions in the comments below, but there seems to be some obvious points of note:
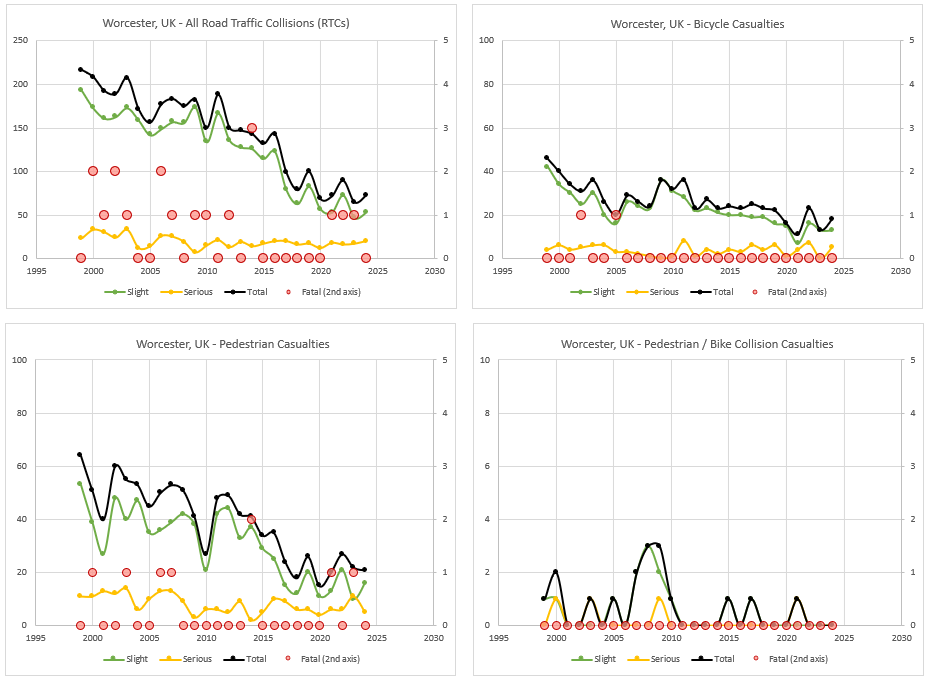
The trend of total RTCs for the data available via this method from 1999 to 2024 is downwards, approximately halving in that time. This is great news. The trend for pedestrian and bicycle casualties is also down, but to a lesser extent.
Slightly more concerning is the recent upturn in the trend since 2020. This will undoubtedly be affected by the Covid pandemic, with fewer car journeys as a result of the lockdowns and people working from home resulting in fewer crashes, but a continuing downward trend towards zero serious injuries and fatalities would presumably be desirable to all stakeholders.
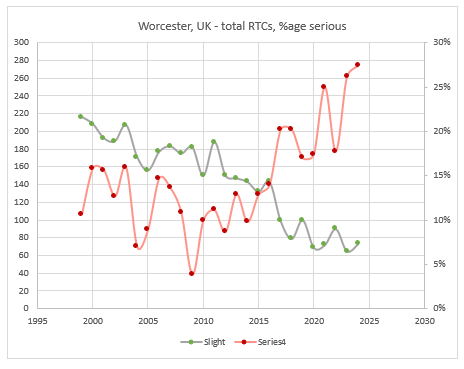
Unfortunately when reviewing serious injuries the reduction is far less, and arguably hasn't reduced since 2004. As a percentage of total injuries this shows an increase over the data set, with the highest point in 2024. Pedestrian and cycling serious casualties are in single figures, but 2022 saw the 2nd highest number of cycling serious injuries in the data set.
When looking at RTCs involving pedestrians and bikes, they are very low, with numbers peaking at 3 in 2008 and 2009, and only 1 serious injury occurring every few years, and no fatalities. A likely explanation is that due to lower mass and speed when cycling the consequence of any collision is far less than that involving a motor vehicle, so much less risk of injury. As a result many crashes will simply be shrugged off, no one is hurt, and therefore the incident isn't reported. Equally not all RTCs involving cars will be reported, notably those that cause damage to infrastructure but not injury.
So that's a quick squint at the RTC data for Worcester. It's complicated. It hasn't been corrected for miles travelled by each mode. It doesn't go into detail of each individual RTC and the particular causes or contributing factors. It is however clear that the vast majority of RTCs involve at least one motor vehicle, and someone driving it. Being a pedestrian isn't as safe as you might think, and that's largely down to to people driving cars, and not people riding bikes.
Despite the observations I’ve made on the data above, I don’t think we should accept this number of RTCs and injuries in our city; it seems it’s simply acknowledged as a price to pay to enable us to drive cars, simply collatoral damage. Personally, I don’t think enough is done by City and County Councils, West Mercia Police and the Police and Crime Commissioner, to acknowledge we have a problem, and to make efforts to reduce these statistics. I’d be interested to know the last time road safety / danger was discussed at either Council. Where are the plans to reduce the destruction, injury and death on our roads? Where’s the joint declaration by all parties to aim for Vision Zero?
Finally I've done a quick lap around the internet looking at scholarly articles weighing the risks associated with cycling against the physical and mental health benefits. I found a nice summary in this article in the New Scientist, and benefits summarised here in a Cycling UK article, and it seems to be fairly conclusive that increasing activity levels wins out. Oh, and this also benefits wider society by reducing carbon emissions and health care costs. Who'd have thunk it?